Aspose.Slides可以帮助开发人员实现幻灯片的创建、编辑、读取和转换等操作,在创建幻灯片的时候为了更清晰和直观的分析数据,很多时候需要在幻灯片里添加各种图表,为了图表更美观和直观还需要对图表中的各种元素进行格式化设置,
Aspose.Slides为广大开发人员提供了强大的API来格式化图表中的轴刻度线、表格线、轴标签格式化、设置坐标轴的最大、最小值、坐标轴的标题、图表的背景色、填充色、图例的设置等多种图表元素的格式化,具体使用方法可以查看下面的Java代码:
// Instantiating presentation
Presentation pres = new Presentation();
// Accessing the first slide
ISlide slide = pres.getSlides().get_Item(0);
// Adding the sample chart
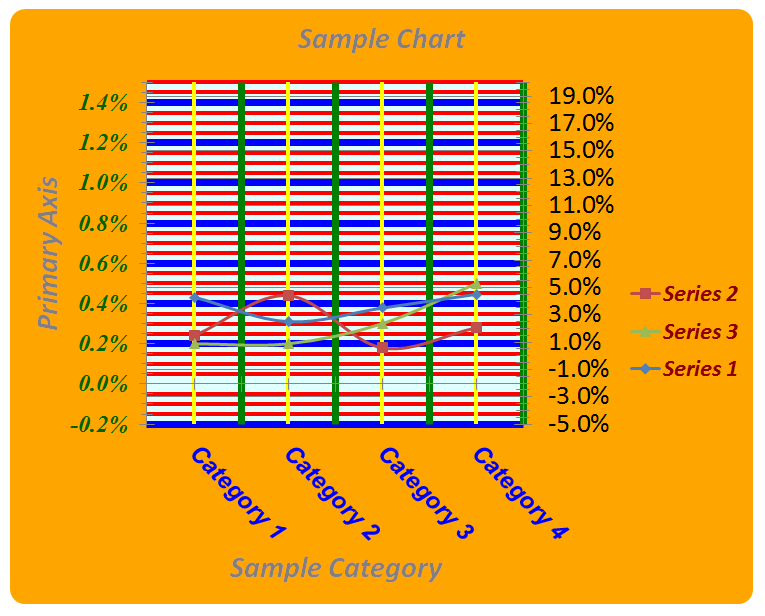
IChart chart = slide.getShapes().addChart(ChartType.LineWithMarkers, 50, 50, 500, 400);
// Setting Chart Title
chart.hasTitle();
chart.getChartTitle().addTextFrameForOverriding("");
IPortion chartTitle = chart.getChartTitle().getTextFrameForOverriding().getParagraphs().get_Item(0)
.getPortions().get_Item(0);
chartTitle.setText("Sample Chart");
chartTitle.getPortionFormat().getFillFormat().setFillType(FillType.Solid);
chartTitle.getPortionFormat().getFillFormat().getSolidFillColor().setColor(Color.GRAY);
chartTitle.getPortionFormat().setFontHeight(20);
chartTitle.getPortionFormat().setFontBold(NullableBool.True);
chartTitle.getPortionFormat().setFontItalic(NullableBool.True);
// Setting Major grid lines format for value axis
chart.getAxes().getVerticalAxis().getMajorGridLinesFormat().getLine().getFillFormat()
.setFillType(FillType.Solid);
chart.getAxes().getVerticalAxis().getMajorGridLinesFormat().getLine().getFillFormat().getSolidFillColor()
.setColor(Color.BLUE);
chart.getAxes().getVerticalAxis().getMajorGridLinesFormat().getLine().setWidth(5);
chart.getAxes().getVerticalAxis().getMajorGridLinesFormat().getLine().setDashStyle(LineDashStyle.DashDot);
// Setting Minor grid lines format for value axis
chart.getAxes().getVerticalAxis().getMinorGridLinesFormat().getLine().getFillFormat()
.setFillType(FillType.Solid);
chart.getAxes().getVerticalAxis().getMinorGridLinesFormat().getLine().getFillFormat().getSolidFillColor()
.setColor(Color.RED);
chart.getAxes().getVerticalAxis().getMinorGridLinesFormat().getLine().setWidth(3);
// Setting value axis number format
chart.getAxes().getVerticalAxis().isNumberFormatLinkedToSource();
chart.getAxes().getVerticalAxis().setDisplayUnit(DisplayUnitType.Thousands);
chart.getAxes().getVerticalAxis().setNumberFormat("0.0%");
// Setting chart maximum, minimum values
chart.getAxes().getVerticalAxis().isAutomaticMajorUnit();
chart.getAxes().getVerticalAxis().isAutomaticMaxValue();
chart.getAxes().getVerticalAxis().isAutomaticMinorUnit();
chart.getAxes().getVerticalAxis().isAutomaticMinValue();
chart.getAxes().getVerticalAxis().setMaxValue(15f);
chart.getAxes().getVerticalAxis().setMinValue(-2f);
chart.getAxes().getVerticalAxis().setMinorUnit(0.5f);
chart.getAxes().getVerticalAxis().setMajorUnit(2.0f);
// Setting Value Axis Text Properties
IChartPortionFormat txtVal = chart.getAxes().getVerticalAxis().getTextFormat().getPortionFormat();
txtVal.setFontBold(NullableBool.True);
txtVal.setFontHeight(16);
txtVal.setFontItalic(NullableBool.True);
txtVal.getFillFormat().setFillType(FillType.Solid);
txtVal.getFillFormat().getSolidFillColor().setColor(new Color(PresetColor.DarkGreen));
txtVal.setLatinFont(new FontData("Times New Roman"));
// Setting value axis title
chart.getAxes().getVerticalAxis().hasTitle();
chart.getAxes().getVerticalAxis().getTitle().addTextFrameForOverriding("");
IPortion valtitle = chart.getAxes().getVerticalAxis().getTitle().getTextFrameForOverriding().getParagraphs()
.get_Item(0).getPortions().get_Item(0);
valtitle.setText("Primary Axis");
valtitle.getPortionFormat().getFillFormat().setFillType(FillType.Solid);
valtitle.getPortionFormat().getFillFormat().getSolidFillColor().setColor(Color.GRAY);
valtitle.getPortionFormat().setFontHeight(20);
valtitle.getPortionFormat().setFontBold(NullableBool.True);
valtitle.getPortionFormat().setFontItalic(NullableBool.True);
// Setting Major grid lines format for Category axis
chart.getAxes().getHorizontalAxis().getMajorGridLinesFormat().getLine().getFillFormat()
.setFillType(FillType.Solid);
chart.getAxes().getHorizontalAxis().getMajorGridLinesFormat().getLine().getFillFormat().getSolidFillColor()
.setColor(Color.GREEN);
chart.getAxes().getHorizontalAxis().getMajorGridLinesFormat().getLine().setWidth(5);
// Setting Minor grid lines format for Category axis
chart.getAxes().getHorizontalAxis().getMinorGridLinesFormat().getLine().getFillFormat()
.setFillType(FillType.Solid);
chart.getAxes().getHorizontalAxis().getMinorGridLinesFormat().getLine().getFillFormat().getSolidFillColor()
.setColor(Color.YELLOW);
chart.getAxes().getHorizontalAxis().getMinorGridLinesFormat().getLine().setWidth(3);
// Setting Category Axis Text Properties
IChartPortionFormat txtCat = chart.getAxes().getHorizontalAxis().getTextFormat().getPortionFormat();
txtCat.setFontBold(NullableBool.True);
txtCat.setFontHeight(16);
txtCat.setFontItalic(NullableBool.True);
txtCat.getFillFormat().setFillType(FillType.Solid);
txtCat.getFillFormat().getSolidFillColor().setColor(Color.BLUE);
txtCat.setLatinFont(new FontData("Arial"));
// Setting Category Title
chart.getAxes().getHorizontalAxis().hasTitle();
chart.getAxes().getHorizontalAxis().getTitle().addTextFrameForOverriding("");
IPortion catTitle = chart.getAxes().getHorizontalAxis().getTitle().getTextFrameForOverriding().getParagraphs()
.get_Item(0).getPortions().get_Item(0);
catTitle.setText("Sample Category");
catTitle.getPortionFormat().getFillFormat().setFillType(FillType.Solid);
catTitle.getPortionFormat().getFillFormat().getSolidFillColor().setColor(Color.GRAY);
catTitle.getPortionFormat().setFontHeight(20);
catTitle.getPortionFormat().setFontBold(NullableBool.True);
catTitle.getPortionFormat().setFontItalic(NullableBool.True);
// Setting category axis label position
chart.getAxes().getHorizontalAxis().setTickLabelPosition(TickLabelPositionType.Low);
// Setting category axis label rotation angle
chart.getAxes().getHorizontalAxis().setTickLabelRotationAngle(45);
// Setting Legends Text Properties
IChartPortionFormat txtleg = chart.getLegend().getTextFormat().getPortionFormat();
txtleg.setFontBold(NullableBool.True);
txtleg.setFontHeight(16);
txtleg.setFontItalic(NullableBool.True);
txtleg.getFillFormat().setFillType(FillType.Solid);
txtleg.getFillFormat().getSolidFillColor().setColor(new Color(PresetColor.DarkRed));
// Set show chart legends without overlapping chart
chart.getLegend().setOverlay(true);
// chart.ChartData.Series[0].PlotOnSecondAxis=true;
chart.getChartData().getSeries().get_Item(0).setPlotOnSecondAxis(true);
// Setting secondary value axis
chart.getAxes().getSecondaryVerticalAxis().isVisible();
chart.getAxes().getSecondaryVerticalAxis().getFormat().getLine().setStyle(LineStyle.ThickBetweenThin);
chart.getAxes().getSecondaryVerticalAxis().getFormat().getLine().setWidth(20);
// Setting secondary value axis Number format
chart.getAxes().getSecondaryVerticalAxis().isNumberFormatLinkedToSource();
chart.getAxes().getSecondaryVerticalAxis().setDisplayUnit(DisplayUnitType.Hundreds);
chart.getAxes().getSecondaryVerticalAxis().setNumberFormat("0.0%");
// Setting chart maximum, minimum values
chart.getAxes().getSecondaryVerticalAxis().isAutomaticMajorUnit();
chart.getAxes().getSecondaryVerticalAxis().isAutomaticMaxValue();
chart.getAxes().getSecondaryVerticalAxis().isAutomaticMinorUnit();
chart.getAxes().getSecondaryVerticalAxis().isAutomaticMinValue();
chart.getAxes().getSecondaryVerticalAxis().setMaxValue(20f);
chart.getAxes().getSecondaryVerticalAxis().setMinValue(-5f);
chart.getAxes().getSecondaryVerticalAxis().setMinorUnit(0.5f);
chart.getAxes().getSecondaryVerticalAxis().setMajorUnit(2.0f);
// Setting chart back wall color
chart.getBackWall().setThickness(1);
chart.getBackWall().getFormat().getFill().setFillType(FillType.Solid);
chart.getBackWall().getFormat().getFill().getSolidFillColor().setColor(Color.ORANGE);
chart.getFloor().getFormat().getFill().setFillType(FillType.Solid);
chart.getFloor().getFormat().getFill().getSolidFillColor().setColor(Color.RED);
// Setting Plot area color
chart.getPlotArea().getFormat().getFill().setFillType(FillType.Solid);
chart.getPlotArea().getFormat().getFill().getSolidFillColor().setColor(new Color(PresetColor.LightCyan));
// Save Presentation
pres.save("FormattedChart.pptx", SaveFormat.Pptx);