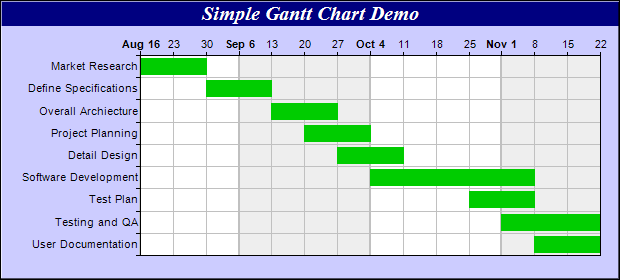
ChartDirector是一款功能强大的图表类型控件,支持多种常用的图表类型以及多种开发语言,并且可以同时应用于桌面应用程序和Web应用程序中。开发人员使用该产品不仅可以快速绘制出很多应用广泛的柱状图、线性图、箱形图、饼图、金融图表、仪表、气泡图、雷达图等,还可以绘制在项目管理上使用的甘特图,虽然在甘特图上不及很多专业的项目管理类控件,但是对于很多简单的项目管理的需求还是满足的,下面代码就如何快速使用
ChartDirector来绘制甘特图做描述:
using System;
namespace CSharpChartExplorer
{
public class gantt : DemoModule
{
//Name of demo module
public string getName() { return "Simple Gantt Chart"; }
//Number of charts produced in this demo module
public int getNoOfCharts() { return 1; }
//Main code for creating chart.
//Note: the argument chartIndex is unused because this demo only has 1 chart.
public void createChart(WinChartViewer viewer, int chartIndex)
{
// data for the gantt chart, representing the start date, end date and names for various
// activities
DateTime[] startDate = {new DateTime(2004, 8, 16), new DateTime(2004, 8, 30),
new DateTime(2004, 9, 13), new DateTime(2004, 9, 20), new DateTime(2004, 9, 27),
new DateTime(2004, 10, 4), new DateTime(2004, 10, 25), new DateTime(2004, 11, 1),
new DateTime(2004, 11, 8)};
DateTime[] endDate = {new DateTime(2004, 8, 30), new DateTime(2004, 9, 13),
new DateTime(2004, 9, 27), new DateTime(2004, 10, 4), new DateTime(2004, 10, 11),
new DateTime(2004, 11, 8), new DateTime(2004, 11, 8), new DateTime(2004, 11, 22),
new DateTime(2004, 11, 22)};
string[] labels = {"Market Research", "Define Specifications", "Overall Archiecture",
"Project Planning", "Detail Design", "Software Development", "Test Plan",
"Testing and QA", "User Documentation"};
// Create a XYChart object of size 620 x 280 pixels. Set background color to light blue
// (ccccff), with 1 pixel 3D border effect.
XYChart c = new XYChart(620, 280, 0xccccff, 0x000000, 1);
// Add a title to the chart using 15 points Times Bold Itatic font, with white (ffffff)
// text on a deep blue (000080) background
c.addTitle("Simple Gantt Chart Demo", "Times New Roman Bold Italic", 15, 0xffffff
).setBackground(0x000080);
// Set the plotarea at (140, 55) and of size 460 x 200 pixels. Use alternative
// white/grey background. Enable both horizontal and vertical grids by setting their
// colors to grey (c0c0c0). Set vertical major grid (represents month boundaries) 2
// pixels in width
c.setPlotArea(140, 55, 460, 200, 0xffffff, 0xeeeeee, Chart.LineColor, 0xc0c0c0, 0xc0c0c0
).setGridWidth(2, 1, 1, 1);
// swap the x and y axes to create a horziontal box-whisker chart
c.swapXY();
// Set the y-axis scale to be date scale from Aug 16, 2004 to Nov 22, 2004, with ticks
// every 7 days (1 week)
c.yAxis().setDateScale(new DateTime(2004, 8, 16), new DateTime(2004, 11, 22), 86400 * 7)
;
// Set multi-style axis label formatting. Month labels are in Arial Bold font in "mmm d"
// format. Weekly labels just show the day of month and use minor tick (by using '-' as
// first character of format string).
c.yAxis().setMultiFormat(Chart.StartOfMonthFilter(), "<*font=Arial Bold*>{value|mmm d}",
Chart.StartOfDayFilter(), "-{value|d}");
// Set the y-axis to shown on the top (right + swapXY = top)
c.setYAxisOnRight();
// Set the labels on the x axis
c.xAxis().setLabels(labels);
// Reverse the x-axis scale so that it points downwards.
c.xAxis().setReverse();
// Set the horizontal ticks and grid lines to be between the bars
c.xAxis().setTickOffset(0.5);
// Add a green (33ff33) box-whisker layer showing the box only.
c.addBoxWhiskerLayer(Chart.CTime(startDate), Chart.CTime(endDate), null, null, null,
0x00cc00, Chart.SameAsMainColor, Chart.SameAsMainColor);
// Output the chart
viewer.Chart = c;
//include tool tip for the chart
viewer.ImageMap = c.getHTMLImageMap("clickable", "",
"title='{xLabel}: {top|mmm dd, yyyy} to {bottom|mmm dd, yyyy}'");
}
}
}