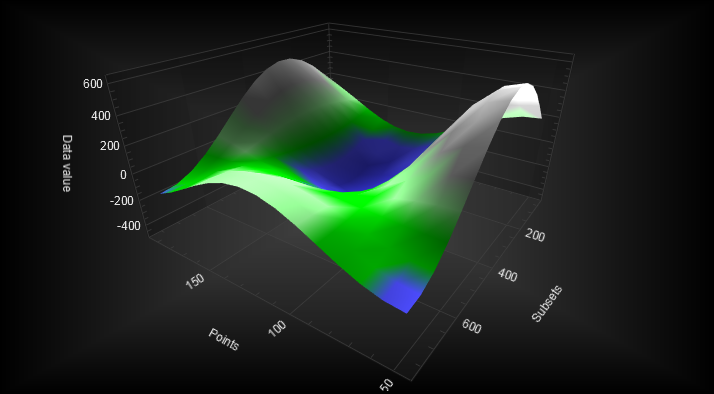
ProEssentials不仅可以创建多种二维图表,还可以帮助开发人员创建多种3D图表,如表面图、3维柱状图、多边形图、瀑布图、云图等,并且该产品还支持多种开发语言:.NET/C++/Delphi/等,是目前市场上比较优秀的一款图表控件产品,这篇文章主要介绍如何使用ProEssentials快速创建一个三维的表面图,具体如下:
// .NET C# Syntax /////////////////////////////////////////////////////////////
// Always start with fresh 3D chart
Pe3do1.PeFunction.Reset();
Pe3do1.PePlot.PolyMode = Gigasoft.
ProEssentials.Enums.PolyMode.SurfacePolygons;
Pe3do1.PeConfigure.PrepareImages = true;
// Set the amount of data and pass data
Pe3do1.PeData.Subsets = 15;
Pe3do1.PeData.Points = 15;
for (int s=0; s<15; s++)
{
for (int p=0; p< 15; p++)
{
Pe3do1.PeData.X[s, p] = 50 + (p * 10);
// p in formula causes XData to increment with each p
Pe3do1.PeData.Z[s, p] = 50 + (s * 50);
// s in formula causes all points to have same ZData value
Pe3do1.PeData.Y[s, p] = (float)(5+35*Math.Cos(p*.4F))*(float)(5+10*Math.Sin(s*.34F));
}
}
Pe3do1.PePlot.ViewingHeight = 30;
Pe3do1.PePlot.DegreeOfRotation = 35;
Pe3do1.PePlot.Method = Gigasoft.
ProEssentials.Enums.ThreeDGraphPlottingMethod.Four;
Pe3do1.PeString.MainTitle = "";
Pe3do1.PeString.SubTitle = "";
Pe3do1.PeString.XAxisLabel = "Points";
Pe3do1.PeString.ZAxisLabel = "Subsets";
Pe3do1.PeString.YAxisLabel = "Data value";
Pe3do1.PeConfigure.RenderEngine = RenderEngine.Direct3D;
Pe3do1.PeColor.BitmapGradientMode = true;
Pe3do1.PeColor.QuickStyle = QuickStyle.DarkNoBorder;
Pe3do1.PeFunction.ReinitializeResetImage();
Pe3do1.Refresh();
///////////////////////////////////////////////////////////////////////////////
// ActiveX VCL Syntax //
Dim s As Integer
Dim p As Integer
'** Always start with this **'
Pe3do1.PEactions = 20 ' Calls PEreset
Pe3do1.PolyMode = PEPM_SURFACEPOLYGONS
Pe3do1.PrepareImages = True
'** Set the amount of data and pass data **'
Pe3do1.Subsets = 15
Pe3do1.Points = 15
For s = 0 To 14
For p = 0 To 14
Pe3do1.XData(s, p) = 50 + (p * 10)
'** p in formula causes XData to increment with each p **'
Pe3do1.ZData(s, p) = 50 + (s * 50)
'** s in formula causes all points to have same ZData value **'
Pe3do1.YData(s, p) = (5+35*Cos(p*.4))*(5+10*Sin(s*.34))
Next p
Next s
Pe3do1.ViewingHeight = 30
Pe3do1.DegreeOfRotation = 35
Pe3do1.PlottingMethod = 4 ' surface with contour
Pe3do1.MainTitle = ""
Pe3do1.SubTitle = ""
Pe3do1.XAxisLabel = "Points"
Pe3do1.ZAxisLabel = "Subsets"
Pe3do1.YAxisLabel = "Data value"
Pe3do1.RenderEngine = PERE_DIRECT3D
Pe3do1.BitmapGradientMode = True
Pe3do1.QuickStyle = PEQS_DARK_NO_BORDER
Pe3do1.PEactions = 0
运行效果图如下: