AnyChart 7.X是一款全新的JavaScript图表控件,完全的跨平台和跨浏览器,支持多种常见的图表类型,多种自定义功能,可扩展和交互性强,是现在WEB图表中最流行的一款。下面我们介绍如何使用AnyChart 7.X轻松地创建图表
1. 下载AnyChart 7.X,然后解压缩到您的电脑里
2. 创建一个HTML文件,取名为index.html,并且打开该文件,并引用下面的代码
<head>
<script src="http://cdn.AnyChart.com/js/latest/AnyChart.min.js" type="text/javascript">
</script>
</head>
其中AnyChart.min.js您可以修改为自己的本地路径
3. 为图表创建一个容器,具体代码如下:
<body>
<div id="container" style="width: 500px; height: 400px;"></div>
</body>
4. 使用控件提供的JavaScript API创建图表,具体代码如下:
<script>
AnyChart.onDocumentLoad(function() {
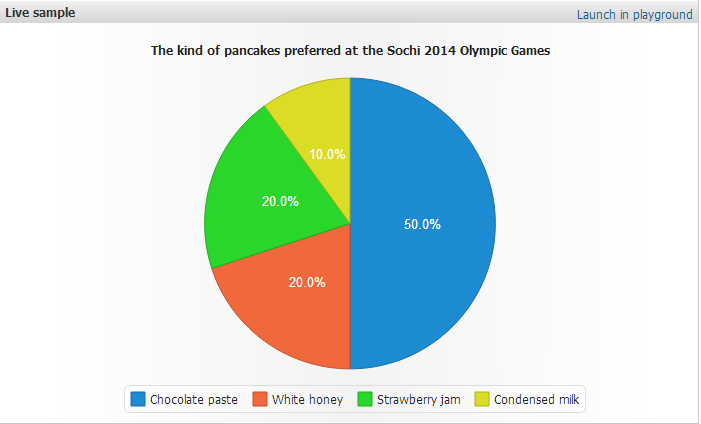
var chart = AnyChart.pieChart([ //create an instance of a pie chart with data
['Chocolate paste', 5],
['White honey', 2],
['Strawberry jam', 2],
['Сondensed milk', 1]
]);
chart.title('The kind of pancakes preferred at the Sochi 2014 Olympic Games');
chart.container('container'); // pass the container id, chart will be displayed
there
chart.draw(); // call the chart draw() method to initiate chart display
});
</script>
通过上面简单的几个步奏,您就完成了图表的创建了,具体运行效果如下: